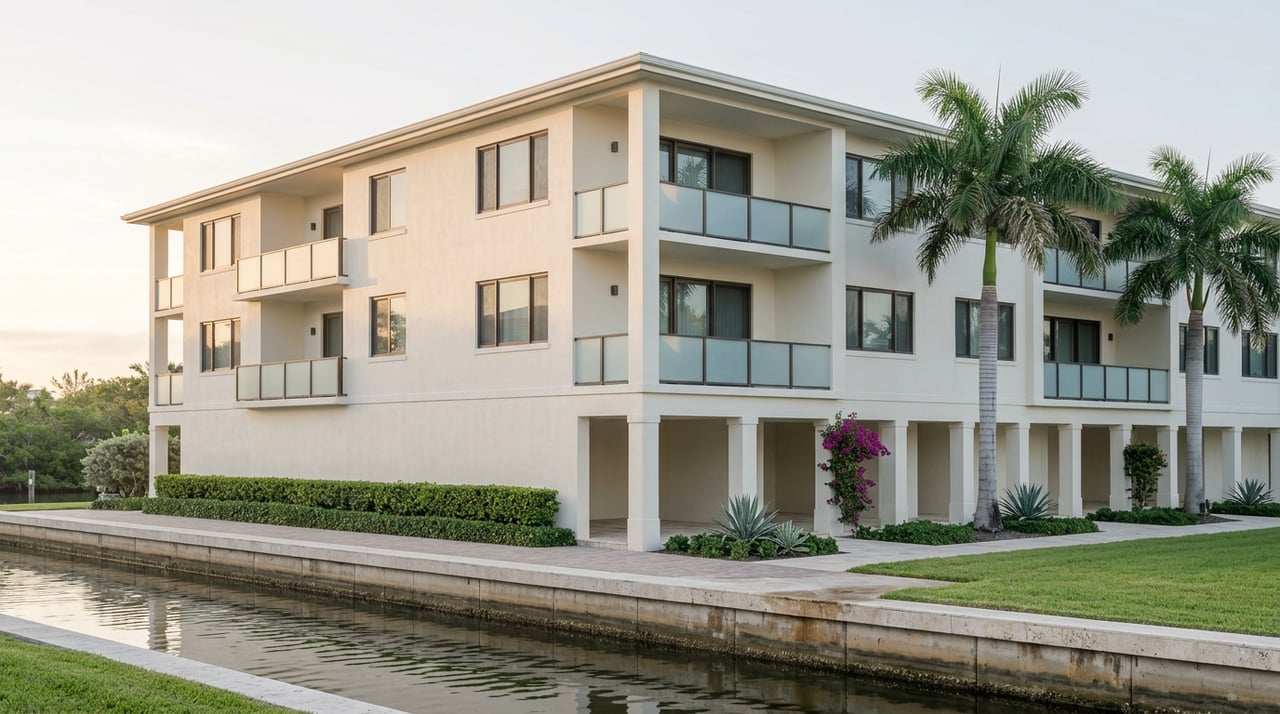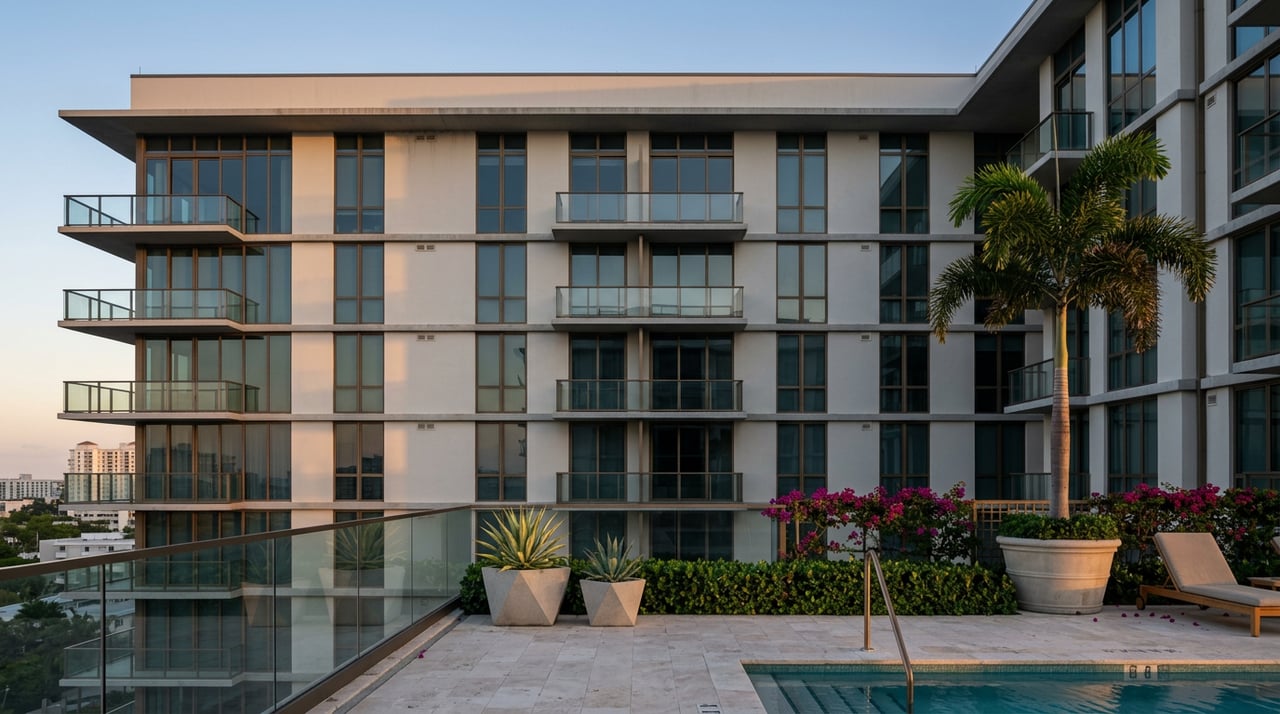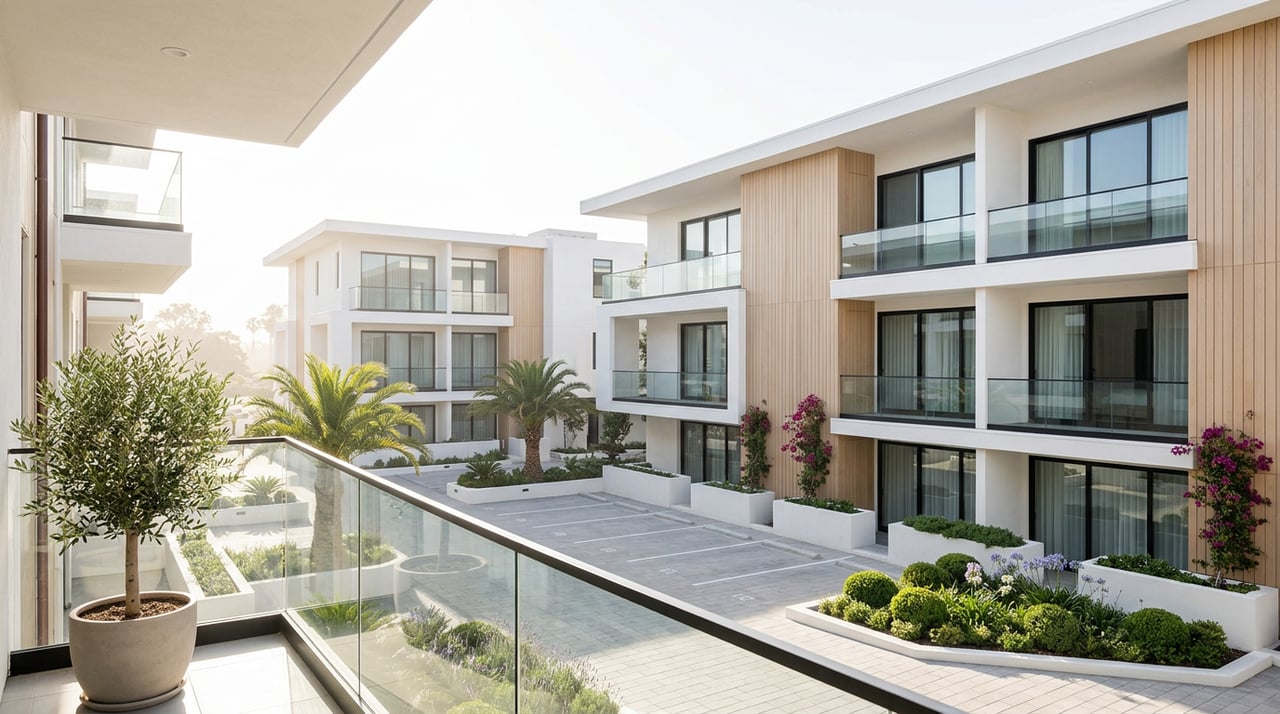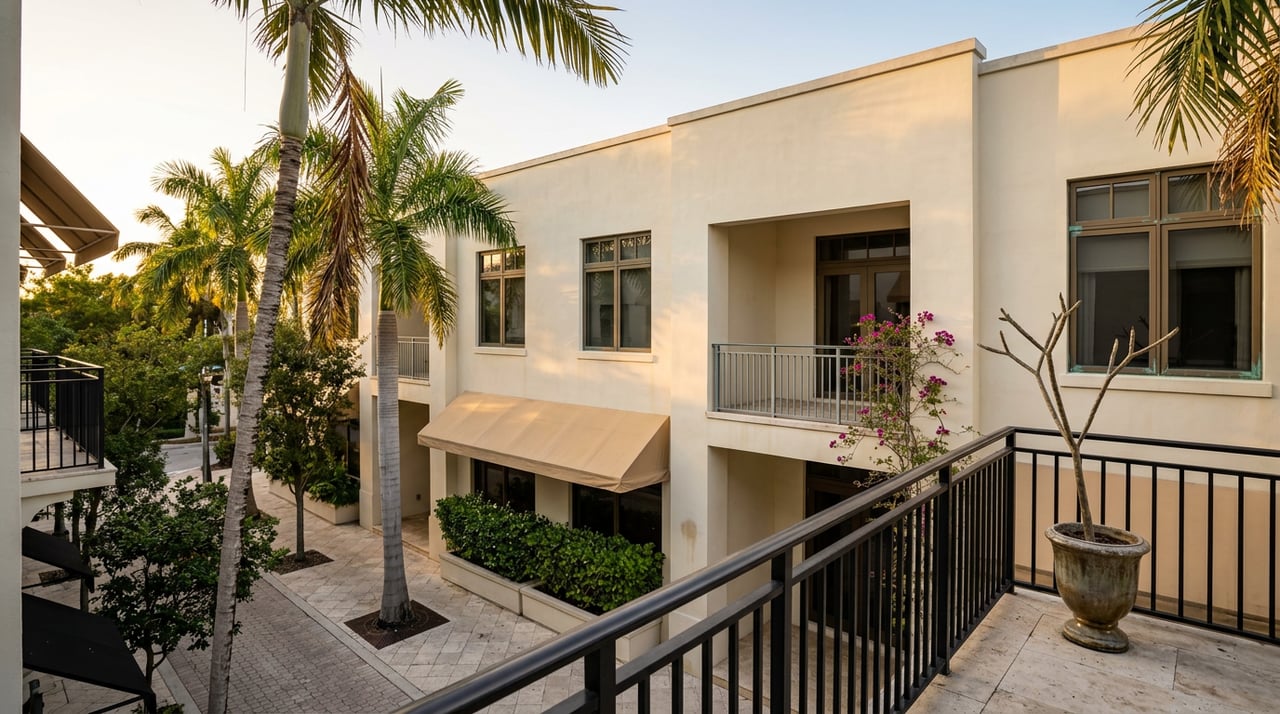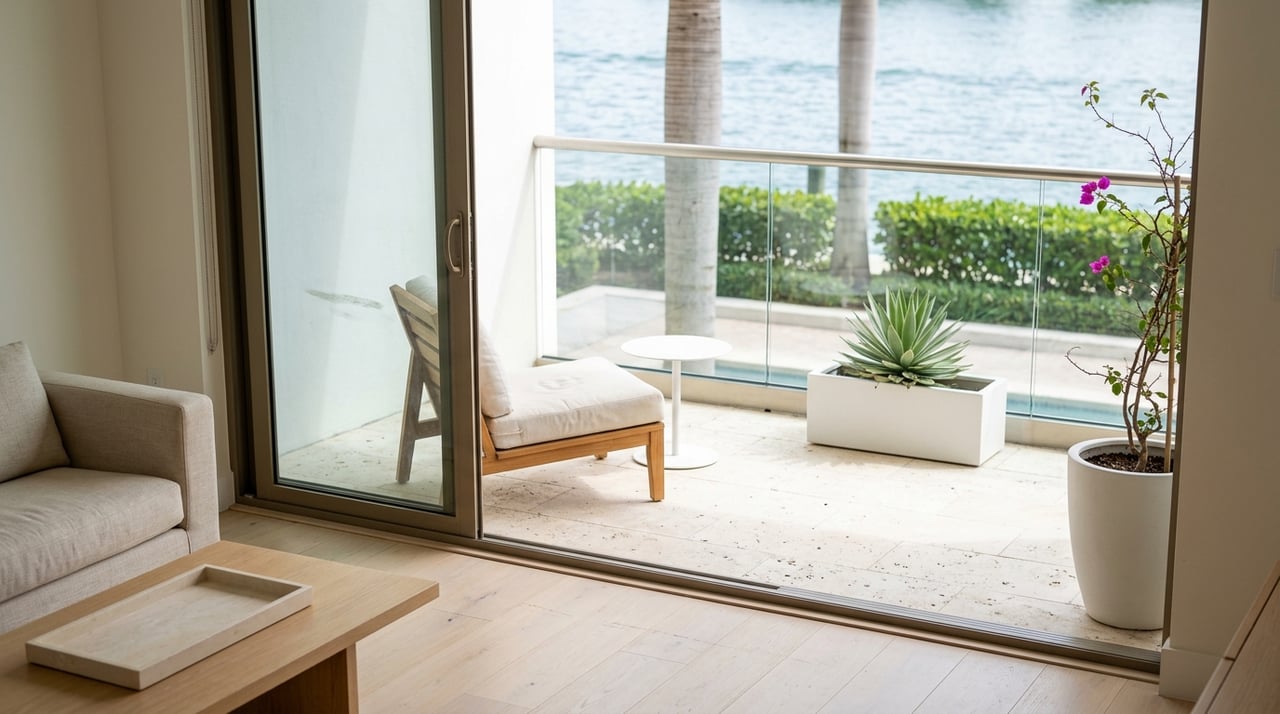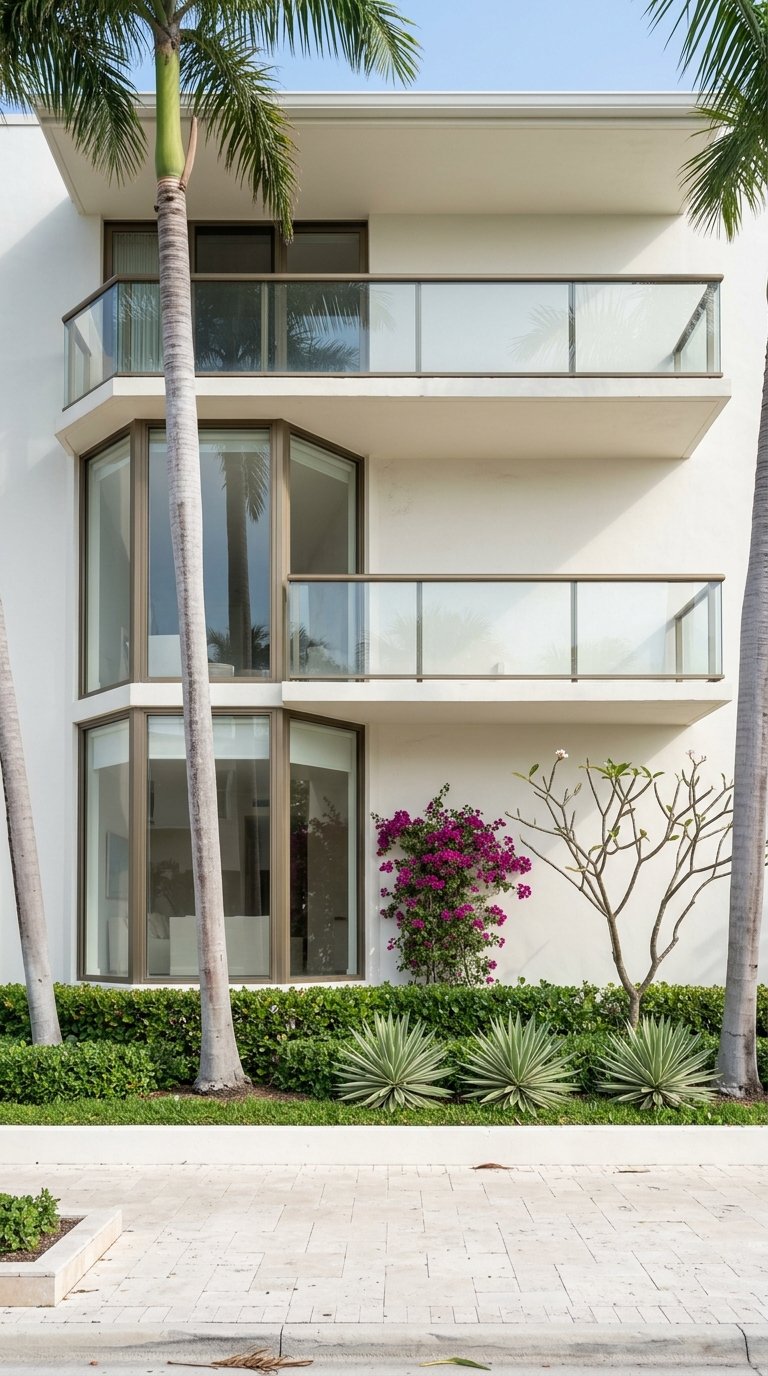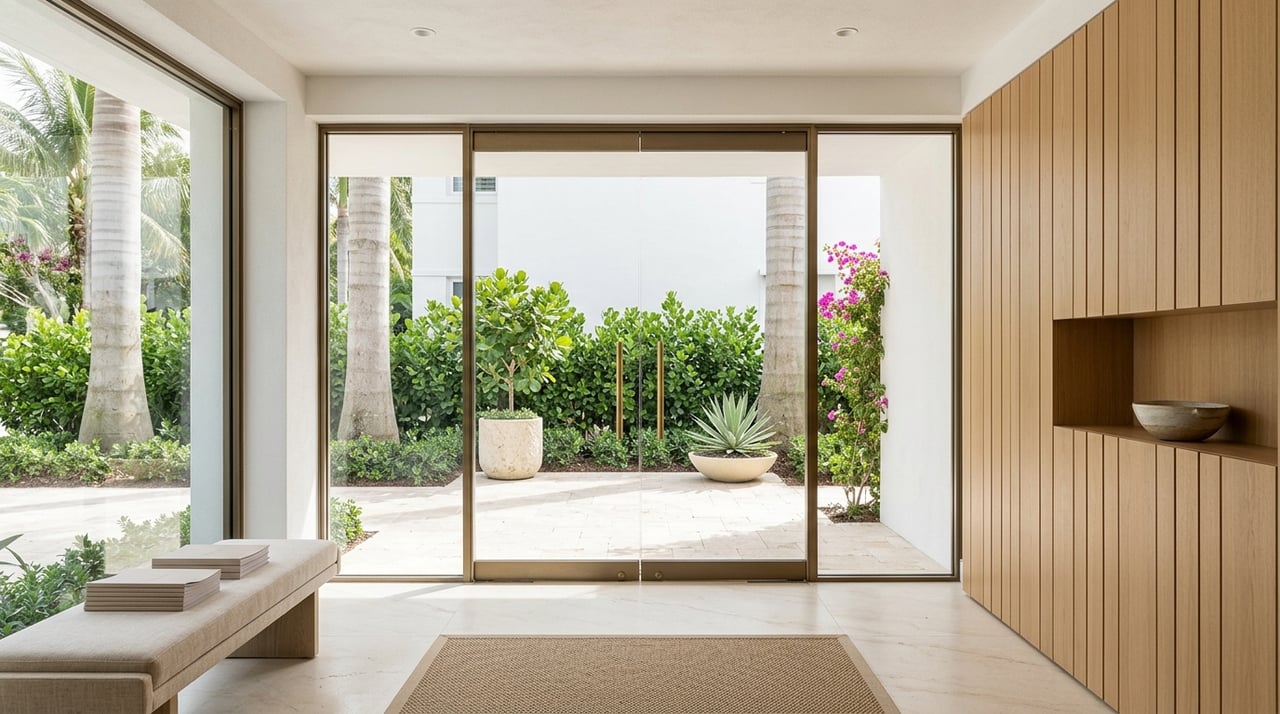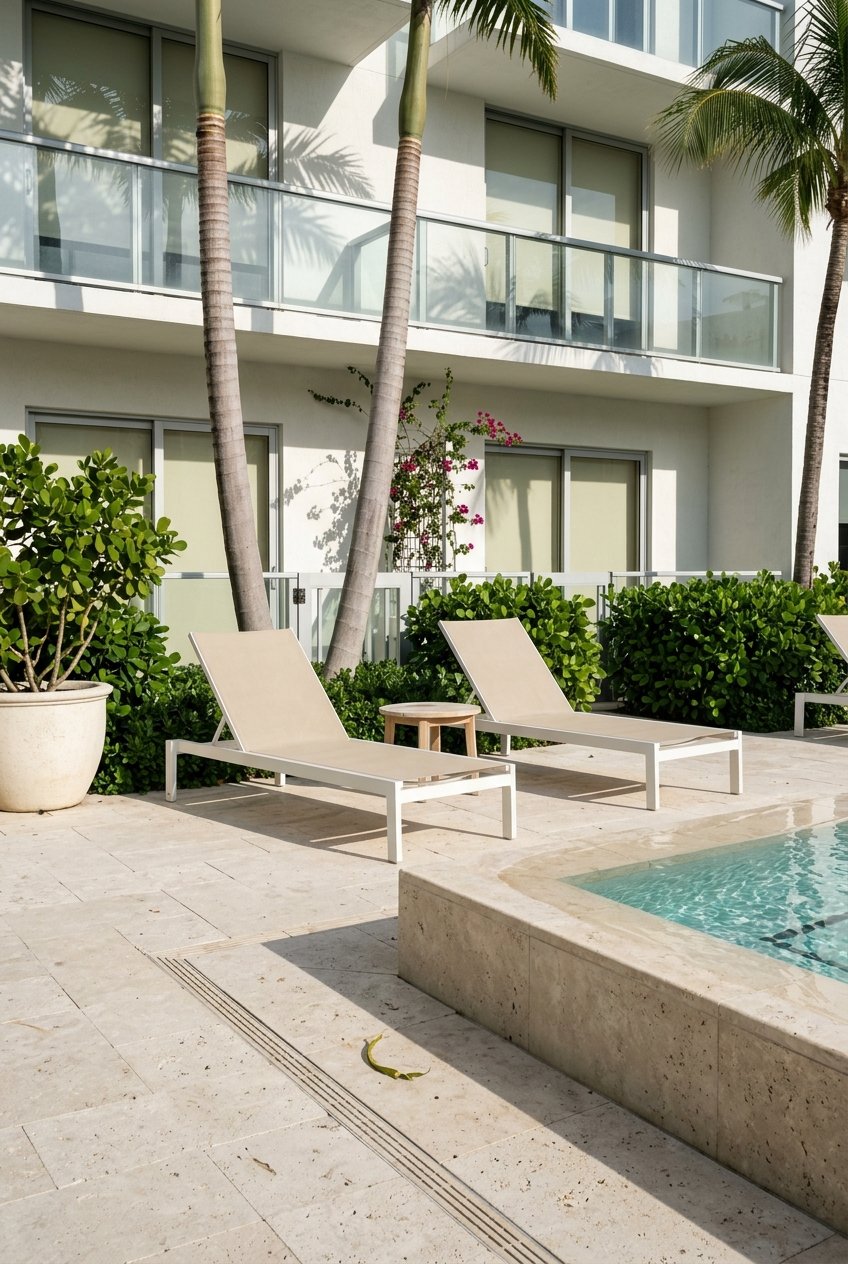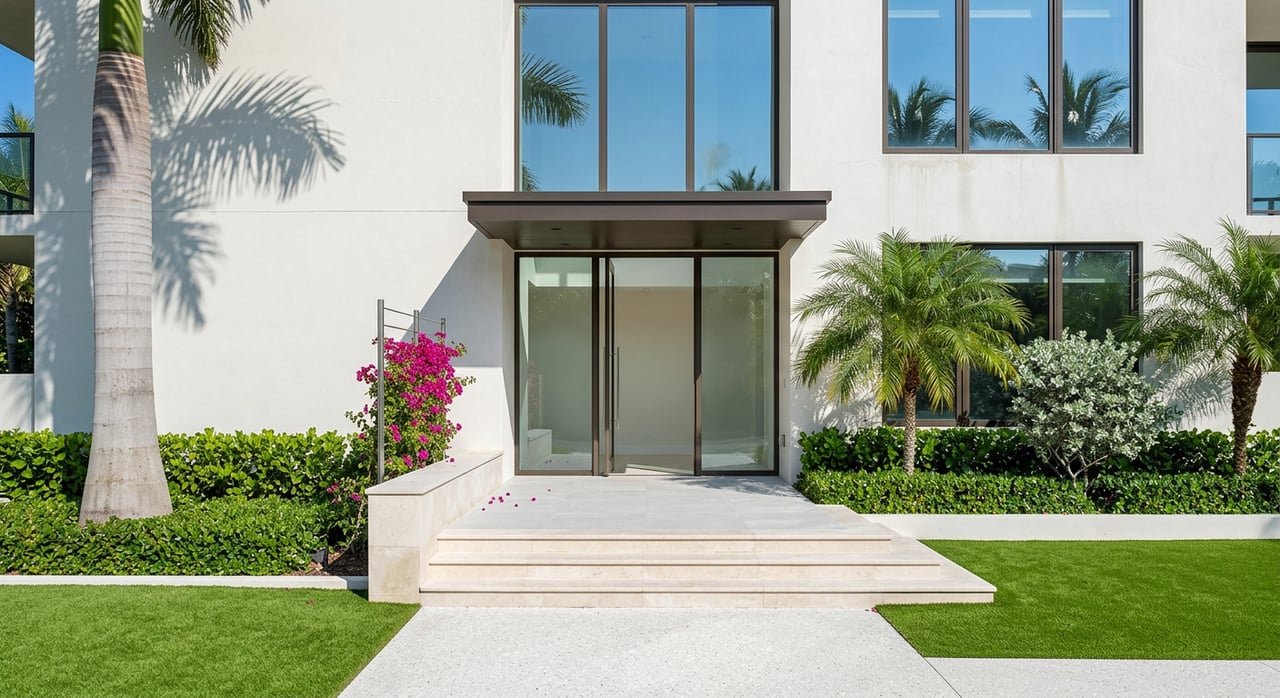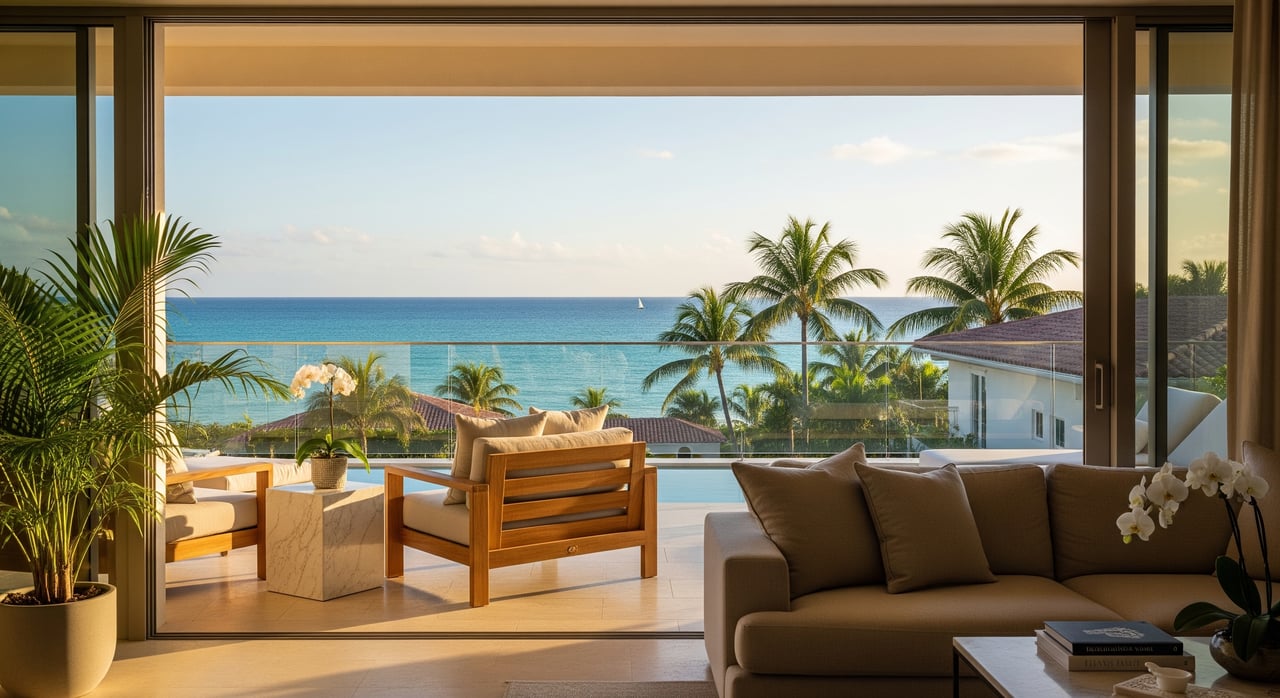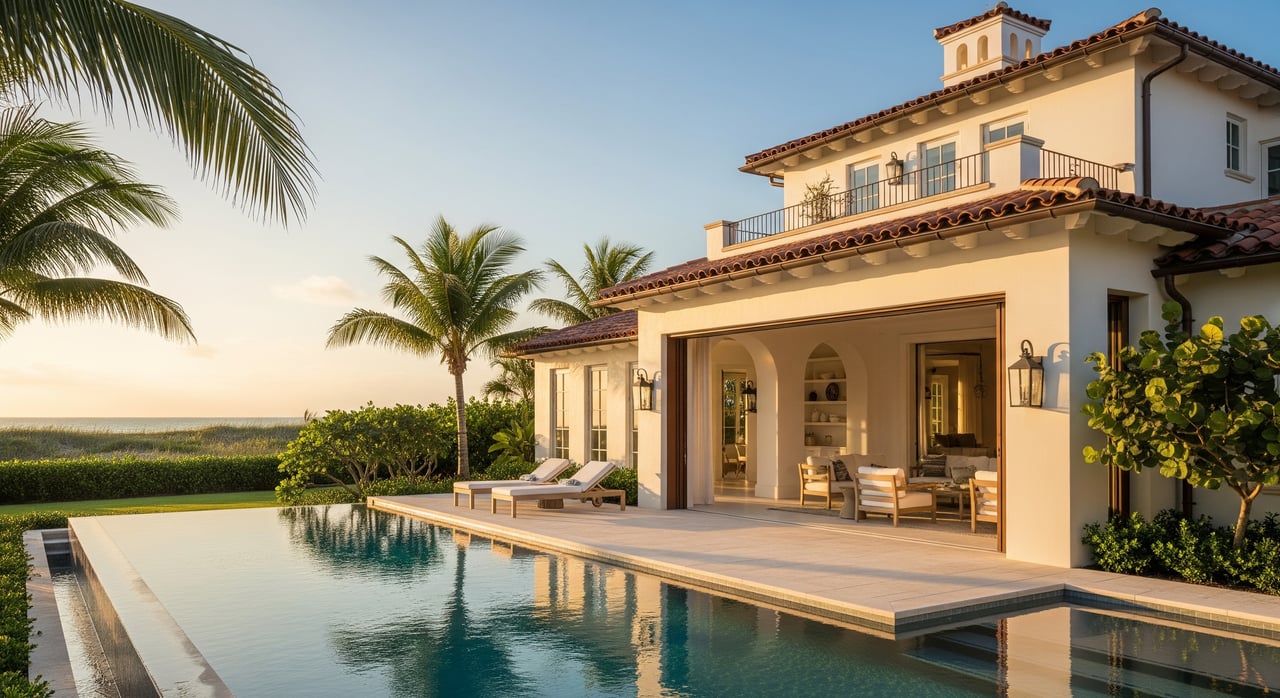
In April 2026, four homes changed hands on Jupiter Island. A condo at 19850 Beach Road closed on April 30 for $2.7 million. Also, a five-bedroom house at 162 South Beach Road closed on April 9 for $6.85 million. That same day, a six-bedroom estate in the Seven Oaks Island enclave at 485 South Beach Road sold for $22.46 million. Between them, a four-bedroom property at 15 South Beach Road closed on April 1 for $12.5 million.
Four sales, one road, thirty days, and a top-to-bottom spread of more than eight times. That range is not an anomaly. It is what the Jupiter Island market looks like every month, and it is the reason the median price you see quoted for this island depends entirely on which handful of sales happened to close in the window a given source is measuring.
What the Portals Actually Disagree About
Pull up five different sources on Jupiter Island in the same year and you get different stories about the same nine mile barrier island.
| Source | Window | What it reported |
|---|---|---|
| One national portal's home value index | Trailing 12 months through May 2026 | Typical home value up 0.6% year over year, to roughly $9.1 million |
| The same portal's sales-based tracker | Three months ending May 2026 | Median sale price down 53.8% year over year, to $7.4 million |
| A separate listings tracker | August 2026 | Median list price down about 24-25% year over year, to $12.7 million |
| Two brokerage MLS tallies | Trailing 12 months through March and July 2026 respectively | Average closed price of $16.3 million versus $12.2 million |
None of these numbers are wrong. They are measuring the same island using different windows, different methods, and in some cases list prices instead of sale prices. But a buyer scanning all five in a single afternoon would reasonably conclude the market is crashing, cooling, and holding steady, all at once. It is doing none of those things. It is doing what a market with almost no transactions does: producing an average that swings wildly depending on which few sales landed inside the frame.
Why Twenty Four Sales a Year Can't Support a Median
Jupiter Island has somewhere between 15 and 27 active listings at any given time, depending on the week you check, and closes somewhere between 17 and 24 sales a year according to two separate brokerage MLS tallies covering overlapping twelve month windows. One tally, running through March 2026, counted 17 sales averaging $16.3 million each. Another, running through July 2026, counted 24 sales averaging $12.2 million each. Those two windows overlap across most of the same year, and the average sale price still differs by 34%.
That gap is not a market that changed direction between March and July. It is what happens when the underlying sample is small enough that a single $22 million estate closing or not closing shifts the whole average by a meaningful amount. A median needs enough transactions to smooth out the outliers. On an island with fewer than a thousand year round residents, where the population swells toward 2,000 only during season, the transaction count never gets there.
This is worth sitting with if you are comparing Jupiter Island to a market like Boca Raton or West Palm Beach, where hundreds of closings a month make the median a genuinely useful shorthand. On Jupiter Island, the median is closer to a coin flip that happens to have a dollar sign in front of it.
The Two Numbers That Don't Swing
If the price averages are unreliable, what should a buyer or seller actually watch? Two figures held remarkably steady across both brokerage tallies even while the average sale price moved by a third.
The list-to-sell ratio came in at 89% in the tally through March 2026 and 92% in the tally through July 2026. That is a real number to plan around. Sellers on Jupiter Island are typically getting somewhere between 89 and 92 cents on every dollar of asking price, which means there is genuine negotiating room, but it is modest, not the steep discounting some buyers expect on a slow-moving luxury island.
Days on market told a similarly consistent story. The tally through March 2026 averaged 152 days to sell. The tally through July 2026 averaged 139 days. A separate listings tracker put the August 2026 figure at 147 days, flat against August 2025. Three sources, three different windows, all landing within a two week band of each other. That is roughly four and a half to five months, which is not a sign of a weak market. It reflects a genuinely thin pool of buyers who can write a check for a multi-acre estate with deeded ocean frontage, and the time it takes to match one of them to the right property.
When one number swings 34% and another holds within a few points across the same period, the second number is the one worth building a strategy around.
One Road, Two Markets, and Sometimes a Third
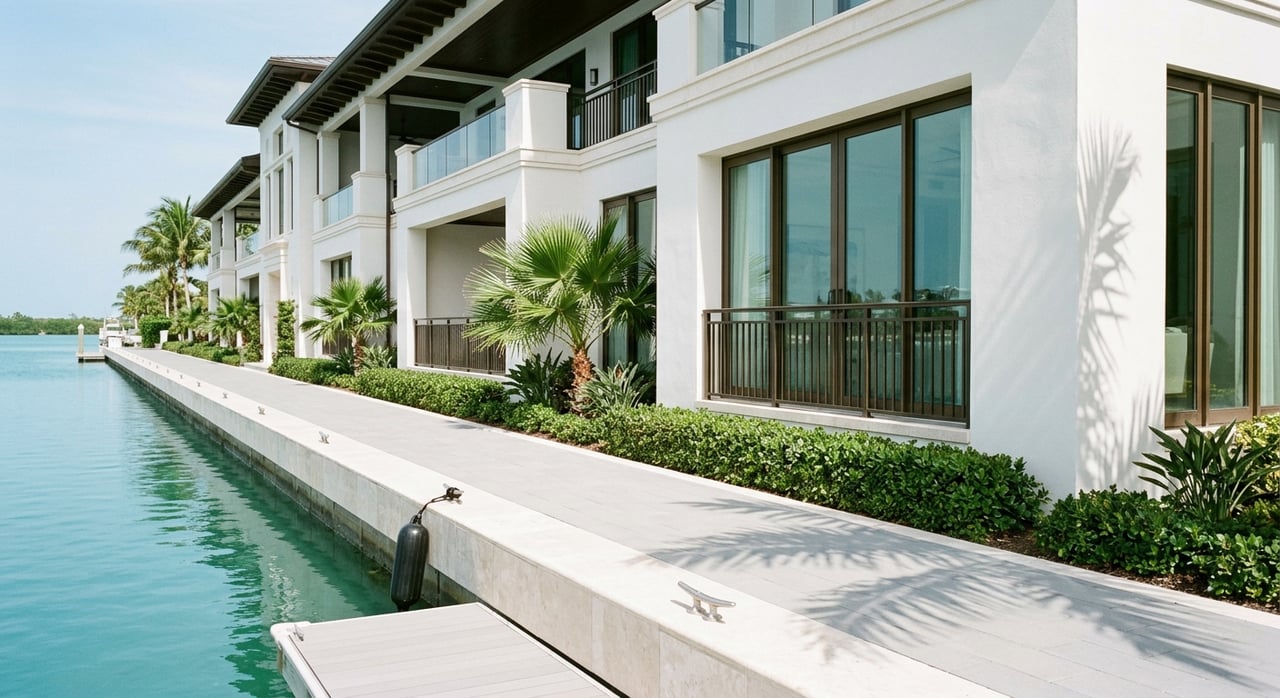
Part of why the price-per-square-foot figures are so hard to pin down is that Jupiter Island is not one market wearing one price tag. Beach Road runs about 9.8 miles from Jupiter Inlet Colony north to Bridge Road in Hobe Sound. The first 1.3 miles, closest to the inlet, is almost entirely oceanfront and Intracoastal condominiums. The remaining 8.5 miles is single family estate territory, much of it on multi-acre lots with private docks and deeded beach access.
The April 2026 sales make the split visible in dollar terms. The Landfall condo closed at roughly $1,000 per square foot. The three single family sales that same month ranged from about $1,566 per square foot at 162 South Beach Road to nearly $3,960 per square foot at 15 South Beach Road, with the Seven Oaks Island estate at 485 South Beach Road landing in between at around $3,540 per square foot.
That is not just condo versus estate. Two houses on the same 8.5 mile stretch, closing in the same nine day window, priced more than double apart per square foot. On an island where lots run from under an acre to several acres with frontage measured in the hundreds of feet, the structure's size explains far less of the price than the land underneath it: how much ocean or Intracoastal frontage comes with it, whether there's a private dock rated for deep-water yacht access, and whether the lot sits inside the architectural review guidelines that govern much of the island's construction. Builders who work here regularly, among them Turtle Beach Construction, Onshore Construction & Development, and RJM Custom Homes, spend as much time managing those guidelines and waterfront permitting as they do managing finishes.
What This Means If You're Actually Shopping
If you are comparing Jupiter Island to other Palm Beach County or Treasure Coast markets, the practical takeaway is to stop anchoring on the median or even the price per square foot you see quoted anywhere, including here. Those figures will look different again in three months, not because the island got more or less desirable, but because a different handful of sales will have closed.
Ask instead about frontage footage, dock depth and lift capacity, deeded beach access, and where a property sits relative to the 1.3 mile condo corridor versus the longer estate stretch toward Hobe Sound. Ask what the list-to-sell ratio has looked like on comparable recent closings, since that number has proven far steadier than any average price. And build your timeline around four to five months rather than the 30 to 45 days a typical single family transaction might take elsewhere in the county. That timeline is not a red flag. It's what matching a buyer to a nine-figure barrier island estate actually takes, on an island whose year round population is smaller than a single Palm Beach condo tower.
The island's exclusivity is not marketing language. Reciprocal club access runs through names like Tequesta Country Club, Seminole Golf Club, and Admirals Cove for owners who aren't members of the on-island, invitation-only Jupiter Island Club. That scarcity is exactly why the price data behaves the way it does. Small numbers of very different properties, changing hands a couple dozen times a year, will never average into a tidy line.
A Few Questions We Hear Often
Is Jupiter Island's market actually cooling in 2026? The data doesn't support that conclusion either way. What looks like a decline in one tracker and a slight increase in another over the same year is the predictable result of measuring a market with roughly 20 annual sales using different windows and methods, not a shift in demand.
Should I expect to negotiate hard on price? Plan for something in the range of the list-to-sell ratios seen across recent twelve month windows, roughly 89 to 92%. That's real room, but it's not the kind of steep discount a slower or more heavily inventoried market might produce.
Jupiter Island rewards buyers and sellers who read past the first number a portal shows them. If you're weighing this market against others in Palm Beach County and want someone who tracks these transactions as they close rather than as a quarterly average, Palm Beach Residential has spent decades doing exactly that kind of reading. List With Cappy.
This article is general information, not legal, tax or financial advice. Consult a qualified professional about your situation.